
N+1 Query Problem in Spring Boot: Detect, Measure, Fix
N+1 is the most common performance bug in enterprise Java projects, and it rarely shows up in development. We show how to count queries, and when to pick JOIN FETCH, @EntityGraph, @BatchSize or a DTO projection, with code.
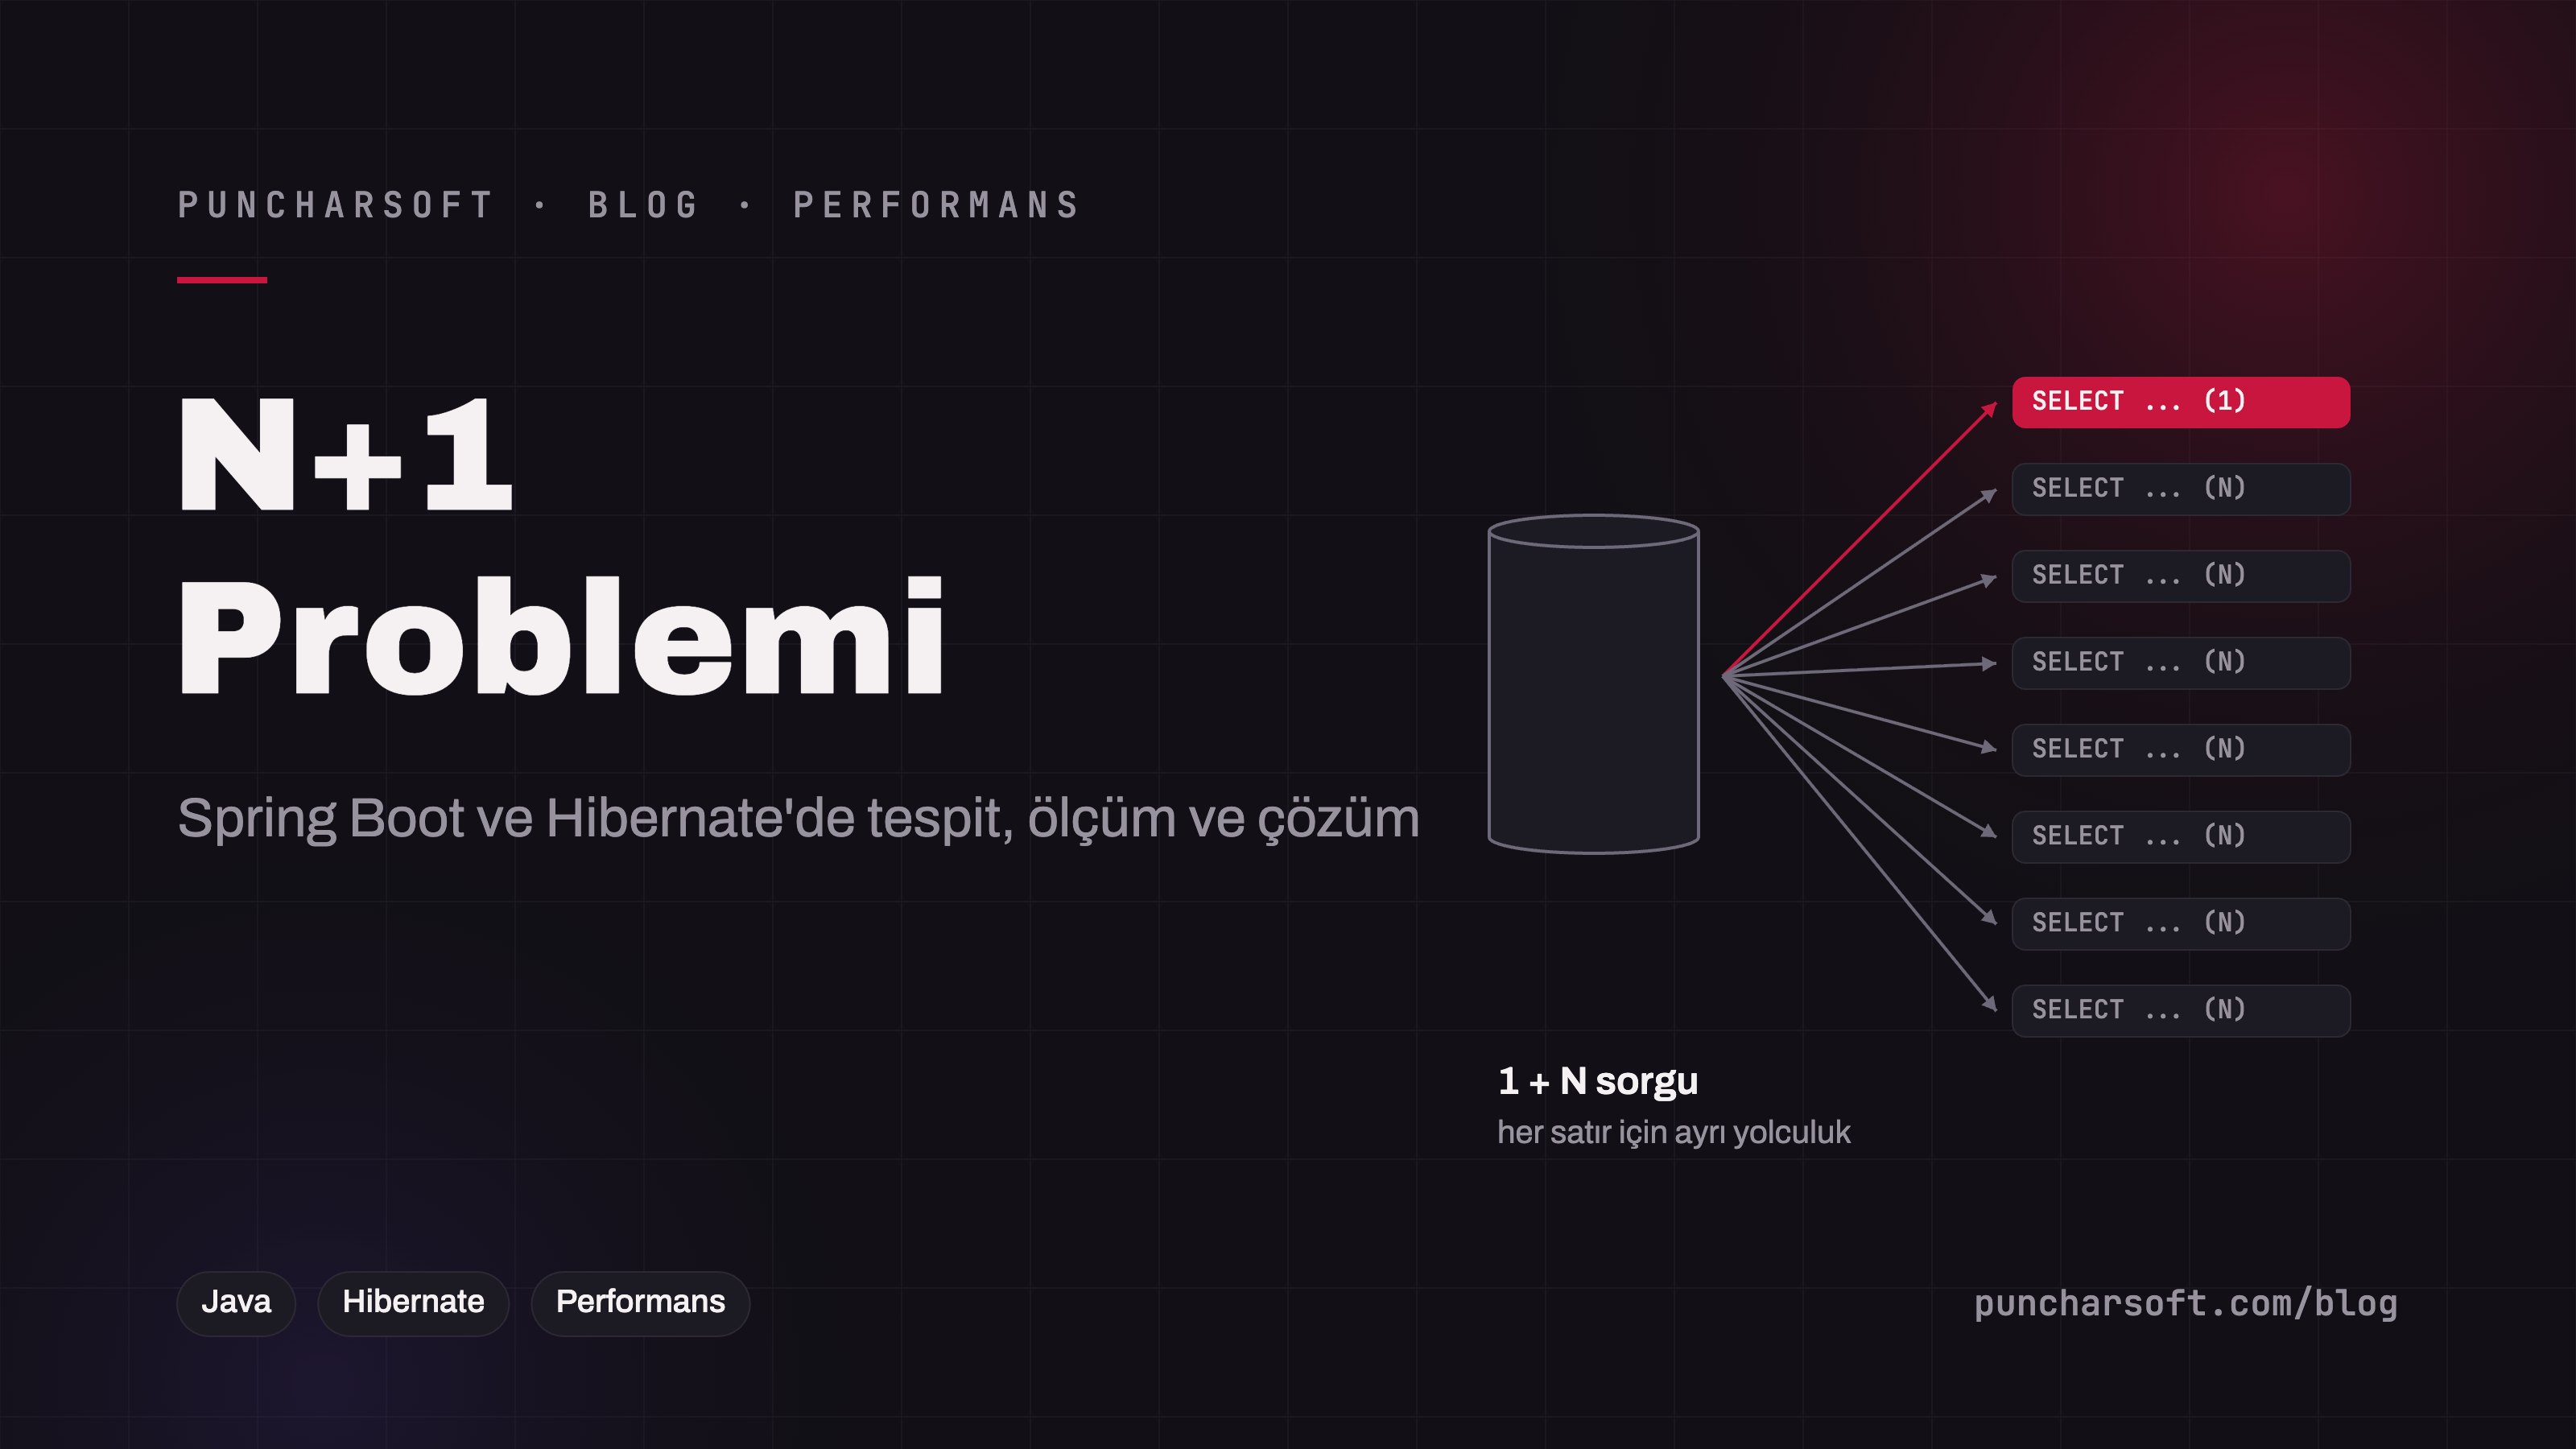
N+1 is the performance bug we see most often in enterprise Java projects, and its danger is exactly this: it goes unnoticed with 20 records in development and turns a screen into a 40-second wait with 20,000 records in production. The code is correct and the tests pass; the application simply goes to the database 20,001 times instead of once.
This article explains how the problem arises in JPA/Hibernate, how to measure the query count, and when each of the four fixes — JOIN FETCH, @EntityGraph, @BatchSize and DTO projections — is the right choice, with code.
How N+1 happens
The classic example: orders and their lines.
@Entity
public class Order {
    @Id private Long id;
    private String number;

    @ManyToOne(fetch = FetchType.LAZY)
    private Customer customer;

    @OneToMany(mappedBy = "order")   // default: LAZY
    private List<OrderLine> lines = new ArrayList<>();
}
List<Order> orders = orderRepository.findAll(); // 1 query
for (Order o : orders) {
total += o.getLines().stream() // +1 query per order
.mapToLong(OrderLine::getAmount).sum();
}Hibernate loads the orders with a single SELECT on the first line. Because getLines() is LAZY, each order's collection is loaded on first access with a separate SELECT ... WHERE order_id = ?. 500 orders, 501 queries. The same applies to @ManyToOne: o.getCustomer().getName() is a new query if the customer isn't already in the persistence context.
Two details matter. First, in JPA @ManyToOne and @OneToOne default to EAGER; that doesn't fix N+1, it moves it elsewhere by adding hidden JOINs or extra SELECTs to every main query. The rule: all associations LAZY, loading strategy decided per query. Second, Spring Boot's open-in-view setting, which is on by default, keeps the persistence context open for the whole HTTP request, so lazy loads triggered in the controller or during JSON serialization silently succeed — you don't see an error, and you don't see the N+1 either.
Detection and measurement: count first, fix second
spring.jpa.show-sql=true prints SQL to the console but doesn't count, and it can't be used in production. We recommend a three-level measurement setup.
1. Hibernate statistics in development
spring:
  jpa:
    open-in-view: false
    properties:
      hibernate:
        generate_statistics: true
logging:
  level:
    org.hibernate.SQL: DEBUG
    org.hibernate.orm.jdbc.bind: TRACE     # Hibernate 6: bound parameters
    org.hibernate.stat: DEBUG              # the Session Metrics line
At the end of every transaction Hibernate logs a line like "Session Metrics { ... 501 JDBC statements prepared ... }". Hundreds of statements for one screen means you have an N+1.
2. Asserting the query count in a test
The real safety net is a test that catches regressions. Hibernate's Statistics object can be used directly in an integration test:
@SpringBootTest
class OrderQueryCountTest {

    @Autowired EntityManagerFactory emf;
    @Autowired OrderService service;

    @Test
    void orderListLoadsWithConstantQueryCount() {
        Statistics stats = emf.unwrap(SessionFactory.class).getStatistics();
        stats.clear();

        service.monthlySummary(YearMonth.of(2026, 9));   // dataset with 500 orders

        assertThat(stats.getPrepareStatementCount())
            .as("query count must not depend on data volume")
            .isLessThanOrEqualTo(3);
    }
}
The value of the test lies in the fixed threshold: when the dataset grows from 50 to 5,000, the count must stay at 3. Running it against a real PostgreSQL with Testcontainers also eliminates the behavioral differences that H2 hides.
3. Monitoring in production
In production, writing the per-request query count to an HTTP header or a log field with datasource-proxy or p6spy makes N+1 visible in real time. Micrometer's Hibernate metrics (hibernate.statements, hibernate.query.executions) can be turned into a "queries per request" panel in Grafana. That panel catches every N+1 that slipped through code review on day one.
Four fixes and when to use each
1. JOIN FETCH
Loads the root entity and the collection in one query. The most direct fix for small, bounded result sets:
@Query("""
    select distinct o from Order o
    join fetch o.lines
    join fetch o.customer
    where o.date between :from and :to
    """)
List<Order> inRangeWithLines(LocalDate from, LocalDate to);
Two traps. Pagination: when a collection fetch is combined with Pageable, Hibernate paginates in memory rather than in SQL because of row multiplication; the whole result set is loaded and a warning is logged. Don't use JOIN FETCH on paginated lists. Multiple collections: fetching two List collections in the same query throws MultipleBagFetchException; either use Set or load the collections in separate queries.
2. @EntityGraph
Achieves the same effect declaratively on a Spring Data repository method, without writing JPQL. Because it separates the loading strategy from the query, the same method can be reused with different graphs for different screens:
public interface OrderRepository extends JpaRepository<Order, Long> {

    @EntityGraph(attributePaths = {"lines", "customer"})
    List<Order> findByDateBetween(LocalDate from, LocalDate to);

    @EntityGraph(attributePaths = "customer")          // list screen: lines not needed
    Page<Order> findByStatus(Status status, Pageable pageable);
}
A JOIN is still generated underneath, so the pagination and multiple-collection constraints apply exactly as above.
3. @BatchSize and default_batch_fetch_size
Loads the collection in separate queries, but in batches: for 500 orders, 5 IN (...) queries in groups of 100 instead of 500. Works fine with pagination, causes no row multiplication, and when enabled globally protects the entire project with one line:
spring:
  jpa:
    properties:
      hibernate:
        default_batch_fetch_size: 100
@OneToMany(mappedBy = "order")
@BatchSize(size = 50) // when one association needs a different size
private List<OrderLine> lines;This is our default recommendation for enterprise projects: default_batch_fetch_size on, deliberate JOIN FETCH on critical queries. Alternatively, @Fetch(FetchMode.SUBSELECT) loads the collection in one go using the main query as a subquery; it can be preferable to an IN list for large main queries.
4. DTO projection
On read-only list and report screens, loading entities is wrong from the start. Pull just the columns you need directly into a record; Hibernate neither fills the persistence context nor creates lazy proxies:
public record OrderSummary(String number, String customerName, BigDecimal amount, long lineCount) {}

@Query("""
    select new com.acme.erp.order.OrderSummary(
        o.number, c.name, sum(l.amount), count(l))
    from Order o
    join o.customer c
    join o.lines l
    where o.date between :from and :to
    group by o.number, c.name
    """)
List<OrderSummary> summary(LocalDate from, LocalDate to);
One query, pagination works, minimal memory. If the screen "shows but doesn't modify", projection is the first choice.
Comparison
Approach | Query count | Pagination | Multiple collections | When |
|---|---|---|---|---|
JOIN FETCH | 1 | In memory (risky) | Bag exception risk | Small, bounded result set; one collection |
@EntityGraph | 1 | In memory (risky) | Bag exception risk | Per-method loading without JPQL |
@BatchSize | 1 + N/size | Fine | Fine | Project-wide default; paginated lists |
DTO projection | 1 | Fine | Fine | Read-only lists and reports |
Team rules so you don't fix N+1 over and over
All associations LAZY.
@ManyToOne(fetch = LAZY)and@OneToOne(fetch = LAZY)are written explicitly; EAGER is rejected in code review.open-in-view=false. Lazy loading outside the service layer throwsLazyInitializationException; that is the desired behavior, it surfaces the mistake early.The repository method says what it loads.
findByStatusandfindByStatusWithLinesare separate methods; the caller knows which part of the entity is loaded.Lombok
@ToStringand@EqualsAndHashCodeexclude associations. A single log line can load an entire collection.A query-count test for every list service. Fixed threshold, large dataset.
Frequently asked questions
Does N+1 only happen with Hibernate?
No; MyBatis, jOOQ or hand-written JDBC produce the same problem whenever a query is issued inside a loop. It is common in Hibernate because lazy loading is invisible: you don't write the query, a getter triggers it.
Does making everything EAGER end N+1?
It doesn't end it, it relocates it. EAGER associations add automatic JOINs or extra SELECTs to every query; they load on screens that don't need them and run outside your control. The right approach is LAZY plus a deliberate loading strategy per query.
What is the right value for default_batch_fetch_size?
For most projects 50–100 is enough. Very high values inflate the IN list and can hurt the query plan; very low values increase the query count. Validate the value with production metrics.
Conclusion
N+1 is a fault of the loading strategy, not of the code, and it is solved permanently not by one rule change but by the trio of measurement, defaults and tests: open-in-view=false, all associations LAZY, default_batch_fetch_size on, projections on read-only screens, and a query-count test for every list service.
To measure and improve the data access layer of your existing application, see our software design and architecture service; for continuous production monitoring and performance reports, see our maintenance and support offering.